Showing posts with label Housing. Show all posts

Saturday, March 22, 2014

Hope for Housing!!!!


With the nasty winter weather that has dominated the Eastern two thirds of the country, real estate have been dampened.  

One only need to listen to the news or google real estate sales to come up with stories on lower sales trends the past two months.
With the major metro areas like Chicago, New York, Atlanta, Philadelphia(and many others) impacted, it is easy to understand the broad malaise in real estate sales.

Yet as Jim notes below, the warmth of Spring will not only make trees blossom and flowers to push through the defrosting landscape. Real Estate will begin to blossom also.  

Sellers will be able to finish prepping the house with fresh mulch and trimmed bushes....and snow melted from the lot!  Nothing like snow to date a picture!!

Buyers will welcome the chance to tour without worrying about removing shoes to maintain carpets and hardwood floors of "their possible new home".   Ask car dealers how much their sales hurt!!
Just  isn't as much fun to look at cars or homes when one is shivering!!!

Won't be long now and you will be burned if you wait to move!!!


Provided to you Exclusively by Jim Belote  
For the week of Mar 24, 2014 | Vol. 12, Issue 12
Jim Belote
Jim Belote
Branch Manager, MBA
Union Mortgage Group
Phone: (757) 395-LOAN
Fax: (757) 351-6471
E-Mail: jim@jimbelote.com
Union Mortgage Group
582 Lynnhaven Parkway, Suite 300
Virginia Beach, VA 23452
In This Issue
Last Week in Review: The harsh winter weather throughout much of the country had a big impact on the housing market. Plus, the Fed met.

Forecast for the Week: Housing reports will be front and center, along with key news on inflation, economic growth, and consumer attitudes.

View: Sharing local statistics with clients and referral partners is easy with this resource.
Last Week in Review
Time for a change. With spring officially here, the change of season will hopefully lead to a change of direction for the housing market, as the harsh winter weather contributed to several disappointing reports.
February Existing Home Sales fell by 0.4 percent from January to 4.60 million units on an annualized basis. While this number was in line with estimates, it was 7.1 percent below the 4.95 million units registered in February 2013. The National Association of Realtors cited the unusually harsh winter weather, tightening of credit, and higher home prices as the cause behind the stagnant sales data.

The harsh weather was also blamed for the weak Housing Starts reading for February, which came in at 907,000, making this the third straight monthly decline. In addition, the National Association of Home Builders Housing Market Index came in at 47 for March. Readings below 50 indicate that more builders view conditions as poor, rather than good. On a positive note, Building Permits, which are a sign of future construction, surged by 7.5 percent to 1.018 million. It will be important to see if readings improve once the weather becomes milder around the nation.

In other news to note, weekly Initial Jobless Claims rose by 5,000 in the latest week to 320,000. Claims continue to hover near lows seen in November, as the labor markets work through the post-recession malaise. The 4-week moving average, which irons out seasonal abnormalities, came in at 327,000, the lowest level since the end of November.

What does this mean for home loan rates? Despite some weaker than expected economic reports, the Fed announced more tapering to its Bond buying program. Beginning in April, the Fed will purchase $30 billion in Treasuries and $25 billion in Mortgage Bonds (the type of Bonds on which home loan rates are based) to help stimulate the economy and housing market. This is down from the original $85 billion per month that the Fed had been purchasing. I will be watching closely to see how this decision impacts the markets and home loan rates as we head further into spring.

The bottom line is that now remains a great time to consider a home purchase or refinance, as home loan rates remain attractive compared to historical levels. Let me know if I can answer any questions at all for you or your clients.
Forecast for the Week
This week's economic calendar is packed with important data on housing, inflation, and economic growth.
  • Housing data is plentiful this week with the S&P Case-Shiller Home Price Index and New Home Sales being reported on Tuesday. Pending Home Sales follows on Thursday.
  • We'll get a read on consumer attitudes towards the U.S. economy with Consumer Confidence on Tuesday and the Consumer Sentiment Index on Friday.
  • Wednesday brings February's Durable Goods Orders, which are orders for items that last for an extended period of time.
  • Weekly Initial Jobless Claims will be released as usual on Thursday. Also look for the final reading of Gross Domestic Product for the fourth quarter of 2013.
  • Ending the week, the inflation-reading Personal Consumption Expenditures data along with Personal Income and Personal Spending will be delivered on Friday.
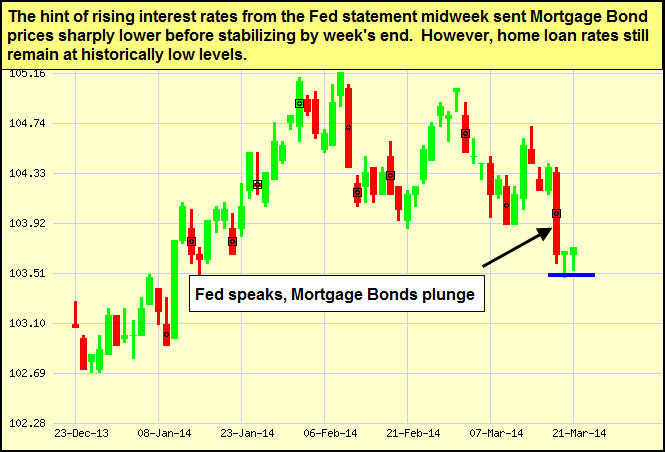
Remember: Weak economic news normally causes money to flow out of Stocks and into Bonds, helping Bonds and home loan rates improve, while strong economic news normally has the opposite result. The chart below shows Mortgage Backed Securities (MBS), which are the type of Bond on which home loan rates are based.

When you see these Bond prices moving higher, it means home loan rates are improving – and when they are moving lower, home loan rates are getting worse.

To go one step further – a red "candle" means that MBS worsened during the day, while a green "candle" means MBS improved during the day. Depending on how dramatic the changes were on any given day, this can cause rate changes throughout the day, as well as on the rate sheets we start with each morning.

As you can see in the chart below, Mortgage Bonds worsened after the Fed meeting but were able to stabilize. Home loan rates remain near historic best levels and I will continue to monitor them closely.
Chart: Fannie Mae 4.0% Mortgage Bond (Friday Mar 21, 2014)
Japanese Candlestick Chart


The Mortgage Market Guide View...
Health Website Makes Sharing Local Data Easy

Gone are the days of extensive research, compiling information, and sharing numerous website links in order to provide local stats and health data with relocating clients and prospects.

Now, finding that information is quick and convenient with County Health Rankings. Through the collaboration of the Robert Wood Johnson Foundation and the University of Wisconsin Population Health Institute, the website brings together 50 diverse reports resulting in a health ranking for each county in the U.S.

How Does Your Community Rank?

1. Visit www.countyhealthrankings.org.

2. Select your state from the map.

3. Once the state map appears, select your county.

Within a few clicks, you can see your county's overall ranking, as well as other important local statistics such as:
  • Population
  • Unemployment
  • Education
  • Smoking and drinking
  • Access to recreational facilities
  • Air pollution
  • Poverty
  • Motor vehicle death rates
  • Diabetes
  • And much more!
Check your local stats and feel free to pass this resource along to your team, clients, and colleagues.


Economic Calendar for the Week of March 24 - March 28
Date
ET
Economic Report
For
Estimate
Actual
Prior
Impact
Tue. March 25
09:00
S&P/Case-Shiller Home Price Index
Jan
NA

13.4%
Moderate
Tue. March 25
10:00
Consumer Confidence
Mar
NA

78.1
Moderate
Tue. March 25
10:30
New Home Sales
Feb
NA

468K
Moderate
Wed. March 26
08:30
Durable Goods Orders
Feb
NA

-1.0%
Moderate
Thu. March 27
08:30
GDP Chain Deflator
Q4
NA

1.6%
Moderate
Thu. March 27
08:30
Gross Domestic Product (GDP)
Q4
NA

2.4%
Moderate
Thu. March 27
08:30
Jobless Claims (Initial)
3/22
NA

NA
Moderate
Thu. March 27
10:00
Pending Home Sales
Feb
NA

0.1%
Moderate
Fri. March 28
08:30
Personal Income
Feb
NA

0.3%
Moderate
Fri. March 28
08:30
Personal Spending
Feb
NA

0.4%
Moderate
Fri. March 28
08:30
Personal Consumption Expenditures and Core PCE
Feb
NA

0.1%
HIGH
Fri. March 28
08:30
Personal Consumption Expenditures and Core PCE
YOY
NA

1.1%
HIGH
Fri. March 28
10:00
Consumer Sentiment Index (UoM)
Mar
NA

79.9
Moderate

The material contained in this newsletter is provided by a third party to real estate, financial services and other professionals only for their use and the use of their clients. The material provided is for informational and educational purposes only and should not be construed as investment and/or mortgage advice. Although the material is deemed to be accurate and reliable, we do not make any representations as to its accuracy or completeness and as a result, there is no guarantee it is without errors.

As your mortgage professional, I am sending you the MMG WEEKLY because I am committed to keeping you updated on the economic events that impact interest rates and how they may affect you.

In the unlikely event that you no longer wish to receive these valuable market updates, please USE THIS LINK or email: jim@jimbelote.com

If you prefer to send your removal request by mail the address is:

Jim Belote
Union Mortgage Group
582 Lynnhaven Parkway, Suite 300
Virginia Beach, VA 23452
Vantage Production, LLC is the copyright owner or licensee of the content and/or information in this email, unless otherwise indicated.   Vantage Production, LLC does not grant to you a license to any content, features or materials in this email.   You may not distribute, download, or save a copy of any of the content or screens except as otherwise provided in our Terms and Conditions of Membership, for any purpose.

Equal Housing Lender          

Monday, February 10, 2014

Interest Rates: Will Cost YOU TO WAIT

Interest Rates
are
                        G
              N
  I
                                  S
                                                     I 
                                      R

                    And it is going to HURT!


 Though various mediums(blogs, Facebook posts, twitter feeds, etc) I have been sharing various mortgage companies, Realtor analyst data and my own input on the pressure on interest rates.

Though the rates are not out of hand,  the handwriting is on the wall and it won't be erased any time soon.   

Add the strengthing home prices seen between 2012 and 2013, you find that the cost of delay is over $200 per month! That equates to over $82,000 over 30 years.   

Look at the data for yourself:


If you have been waiting to sell or to buy, don't think that you missed out!  That is very limited thinking.   Sure you didn't buy Google either at $45 so can be upset that it is over $1000 now.  Yet, I doubt it is what wakes you up every day.

The same is true of missing out when prices were at there bottom two years ago and interest rates were lower.  Prices are still very
sharp in most of the country and in Hampton Roads specificially.  And rates are way way below historical averages(7.5% range).

Thus,  the getting is still very good.   

So don't wait!!!  Now is the time to sell and downsize or upsize. 
Now is the time to STOP paying rent and save by owning a home.

What are you waiting for??????

Friday, July 19, 2013

Foreclosures Down for the Count??

Foreclosures in the news again!!

Yet, it is good news for home owners this time!  Foreclosures continue to decline both as a percentage of listed homes and of homes under contract.  The same is true for homes knows as a "Short Sale" in which the home owner owes more than what he/she can sell the home for in the present market.

With the continuing improvement in values caused by increased buyer activity(hoping to get the lowest rates before they go up) and the housing shortage,   you can expect fewer foreclosure filings and fewer foreclosure as time goes on.

Enjoy an encouraging read:

Hampton Roads foreclosure rate dipped in June

Posted to: Business Realty News 

VIRGINIA BEACH
The Hampton Roads real estate market on Thursday got a double dose of good news as it lumbers toward recovery.
The percentage of sales that were either foreclosures or short sales – a segment that’s collectively considered “distressed” – dropped to a three-year low across the region, according to the Real Estate Information Network, a Virginia Beach-based multiple listing service.
And the median price of existing homes sold in South Hampton Roads in June leapt 10.6 percent to $219,500, up from $198,500 in June 2012, according to REIN’s data.
It was the largest year-over-year increase in any month since the market began to recover early last year.
Vinod Agarwal, a professor of economics at Old Dominion University, said he is “cautiously optimistic” that the local recovery is picking up steam but that it’s too early to say whether June’s figures were an anomaly or the start of a trend.
“It’s only one month,” Agarwal said.
The share of distressed sales in Hampton Roads is still significantly higher than it was before 2008, Agarwal said.
The percentage of sales of existing homes that were distressed in June dropped to 22.8 percent – the lowest it has been since June 2010, when it was at 20.8 percent.
“Once it comes down to about 10 percent or below, the effects of distressed sales would become insignificant,” Agarwal said, meaning median prices likely will climb.
Ideally, the share should decrease to 5 percent or below, he said.
Otherwise, the housing market continues to show signs of improvement, Agarwal said.
Median prices were up significantly in June, and sales volume in South Hampton Roads increased about 6 percent year-over-year.
The number of days a home spends on the market dipped to 83 – the lowest level since September 2010.
A statement from REIN said economists partly are attributing a spike in activity to the recent increase in mortgage rates, which spurred some fence-sitters to buy out of fear that rates would climb even higher.

Sarah Kleiner Varble, 757-446-2318, sarah.varble@pilotonline.com

Wednesday, April 24, 2013

Lender's Scoop!!

Inside Lending from Jeff Hurd
Jeff HurdJeff Hurd
Loan Officer
780 Lynnhaven Parkway #420
Virginia Beach, VA 23452
Mobile: 757-329-1115
Fax: 866-396-6422
PrimeLending, A PlainsCapital Company
For the week of April 22, 2013 – Vol. 11, Issue 16

QUOTE OF THE WEEK...
 "We do not have to become heroes overnight. Just a step at a time, meeting each thing that comes up,...discovering we have the strength to stare it down." --Eleanor Roosevelt

Our hearts go out to the Boston bombing victims and their families. Our pride goes out to the heroes who responded with sacrifice and courage. God Bless America.

>> Market Update 

INFO THAT HITS US WHERE WE LIVE... Last week Housing Starts were reported UP 7.0% for March to a 1.036 million unit annual rate, 46.7% higher than a year ago and the highest they've been since 2008. But wait. The boost was all due to multi-family units, up 31.1% for the month. Single-family starts were down 4.8%, although they actually are UP a very healthy 28.7% from a year ago. Analysts tell us the multi-family sector is super volatile from month to month, but they expect large gains for home building overall for at least two years.

Building Permits in March were down a bit, to a 902,000 annual rate, but almost all the drop was due to multi-families. Single-family permits slipped just 0.5% for the month and are now UP 27.7% versus a year ago. The National Association of Home Builders (NAHB) confidence index went to 42 from 44 in March. But get this. The NAHB index for future single-family sales rose from 50 to 53, a very positive sign.Economists say it's OK in a recovery to see up and down indicators along the way, as long as the underlying trend is upward, which it is now in housing.

BUSINESS TIP OF THE WEEK... Focus. Set goals, make decisions, get organized. Don't just watch life happen; take control of your destiny. As Yogi Berra said: "If you don't know where you are going, you'll wind up somewhere else."

>> Review of Last Week

DOWN... It was a volatile week on Wall Street, with corporate earnings , economic data, commodities, and global growth worries keeping investors on edge. When all was said and done, it was no surprise that the three major stock indexes closed markedly down for the week. Q1 corporate earnings were a mixed bag, with IBM missing forecasts and Microsoft beating them. General Electric's profits were in line with projections, but McDonald's missed. Google happily reported a double-digit increase in net revenue from its core Internet business.

Economic data was also mixed. The New York Empire and Philadelphia Fed manufacturing indexes both missed estimates, indicating slowing activity in those regions. The NAHB Housing Market index and March Building Permits also came in lower than expected. But Industrial Production and Housing Starts both pushed past forecasts, clearly positive signs for factories and home builders. Yet crude oil and gold futures were hammered and global growth concerns returned, as China's Q1 GDP rose at a 7.7% annual rate when 8.0% was expected.
The week ended with the Dow down 2.1%, to 14548; the S&P 500 also down 2.1%, to 1555; and the Nasdaq down 2.7%, to 3206. 
Atypically, the heavy selling in stocks did not spur a flight to safety to bonds, which ended the week little changed. The FNMA 3.5% bond we watch ended the week up .01, at $106.09. After the prior week's soft retail and consumer sentiment numbers, national average mortgage rates edged lower for the third week in a row. The Mortgage Bankers Association put purchase loan applications at their highest level since May 2010, up 4% for the week and up 20% versus a year ago. 

DID YOU KNOW?... GDP, Gross Domestic Product, is the total value of all goods and services produced in a country in a year. It equals total consumer, investment, and government spending, plus the value of exports, minus the value of imports.

>> This Week’s Forecast

HOME SALES SOLID, DURABLE GOODS SINK, GDP SOARS... The week should begin with solid home sales numbers for March, the annual rate of Existing Home Salessurpassing the 5M threshold and New Home Sales moving ahead nicely. But as usual, any excitement will be tempered. In this case, Durable Goods Orders for March are expected to slide 3.1%.

In spite of this, the first Advanced Q1 GDP reading is forecast to show economic growth proceeding at an encouraging 2.8% annual rate. This is good news following the negative to anemic GDP growth numbers we saw for Q4.

>> The Week’s Economic Indicator Calendar

Weaker than expected economic data tends to send bond prices up and interest rates down, while positive data points to lower bond prices and rising loan rates. 

Economic Calendar for the Week of Apr 22 – Apr 26

 DateTime (ET)ReleaseForConsensusPriorImpact
M
Apr 22
10:00Existing Home SalesMar5.01M4.98MModerate
Tu
Apr 23
10:00New Home SalesMar415K411KModerate
W
Apr 24
08:30Durable Goods OrdersMar–3.1%5.6%Moderate
W
Apr 24
10:30Crude Inventories4/20NA–1.233MModerate
Th
Apr 25
08:30Initial Unemployment Claims4/20351K352KModerate
Th
Apr 25
08:30Continuing Unemployment Claims4/133.060M3.068MModerate
F
Apr 26
08:30GDP–AdvancedQ12.8%0.4%Moderate
F
Apr 26
08:30GDP Chain Deflator–Adv.Q11.6%1.0%Moderate
F
Apr 26
09:55Univ. of Michigan Consumer Sentiment–FinalApr72.472.3Moderate

>> Federal Reserve Watch   

Forecasting Federal Reserve policy changes in coming months... Last Thursday Minneapolis Fed president Narayana Kocherlakota said financial market conditions requiring the Fed to keep rates super low may persist for 5 to 10 years. More cause for economists to expect no change in the Funds Rate. Note: In the lower chart, a 1% probability of change is a 99% certainty the rate will stay the same.
Current Fed Funds Rate: 0%–0.25%
After FOMC meeting on:Consensus
May 10%–0.25%
Jun 190%–0.25%
Jul 310%–0.25%

Probability of change from current policy:

After FOMC meeting on:Consensus
May 1     <1 span="">
Jun 19     <1 span="">
Jul 31     <1 span="">